Optimizing Map Filter for a Smarter Search Experience
Users struggled with the map filters, often missing key features due to a cluttered and unintuitive UI. I redesigned the experience to improve clarity, making it easier to discover and apply filters quickly.
Challenge
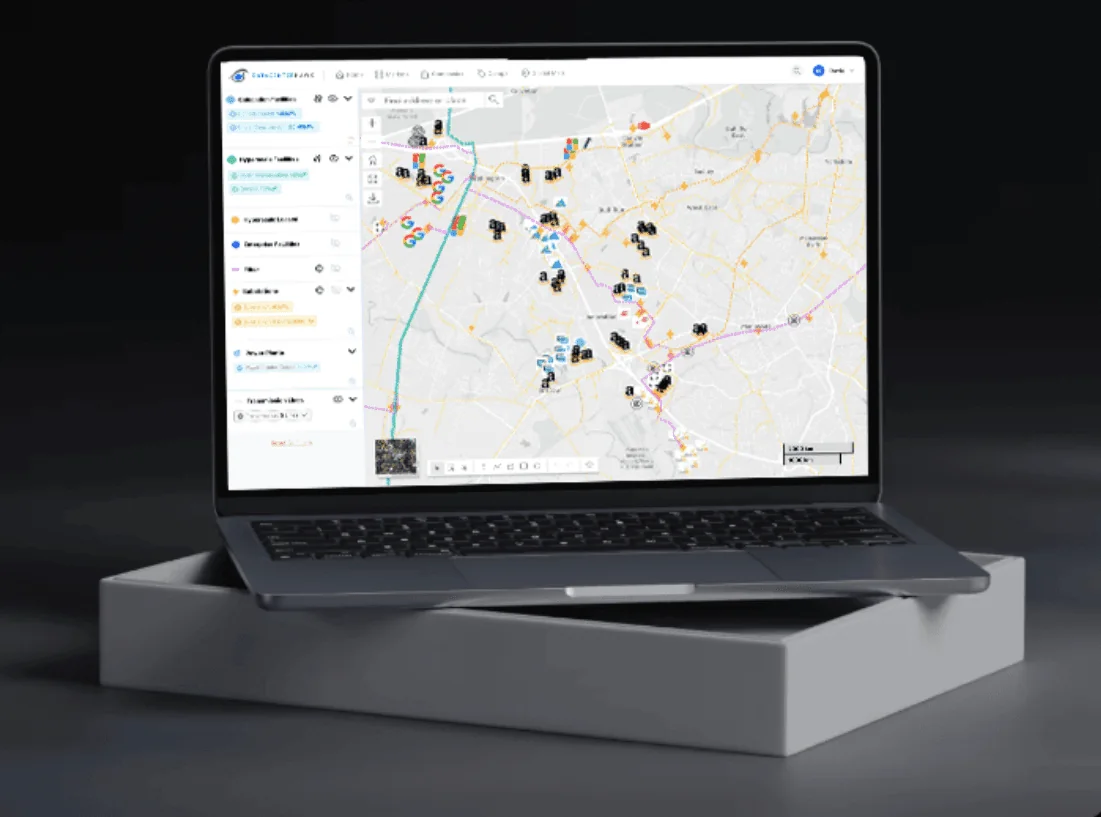
Users were experiencing difficulty navigating the map filtering system, often missing key features or struggling to make adjustments efficiently. While the platform offered robust data, the UI design was limiting discoverability and ease of use.
Results
By redesigning the map filtering system, we saw a 40% increase in feature discoverability and a 35% improvement in task completion time for common filtering actions. User error rates dropped by 25%, and satisfaction scores—measured through post-task surveys—increased by 45%. Overall, the improved UI led to a more intuitive experience, allowing users to access robust data more efficiently and confidently.
Process
Research & Analysis
We conducted user interviews, surveys, and reviewed behavioral analytics to uncover why users were struggling with the filtering system. In addition, we analyzed competing mapping tools and industry standards to identify best practices and gaps in user expectations.
Information Architecture
Based on research insights, we restructured the filtering logic and map interface, prioritizing usability and data discoverability. The new IA simplified workflows and made it easier for users to find and apply relevant filters.
Usability Testing
We tested the prototype with a mix of new and returning users, focusing on task efficiency and feature discoverability. The feedback led to targeted refinements that improved clarity and reduced user friction.
Visual Design
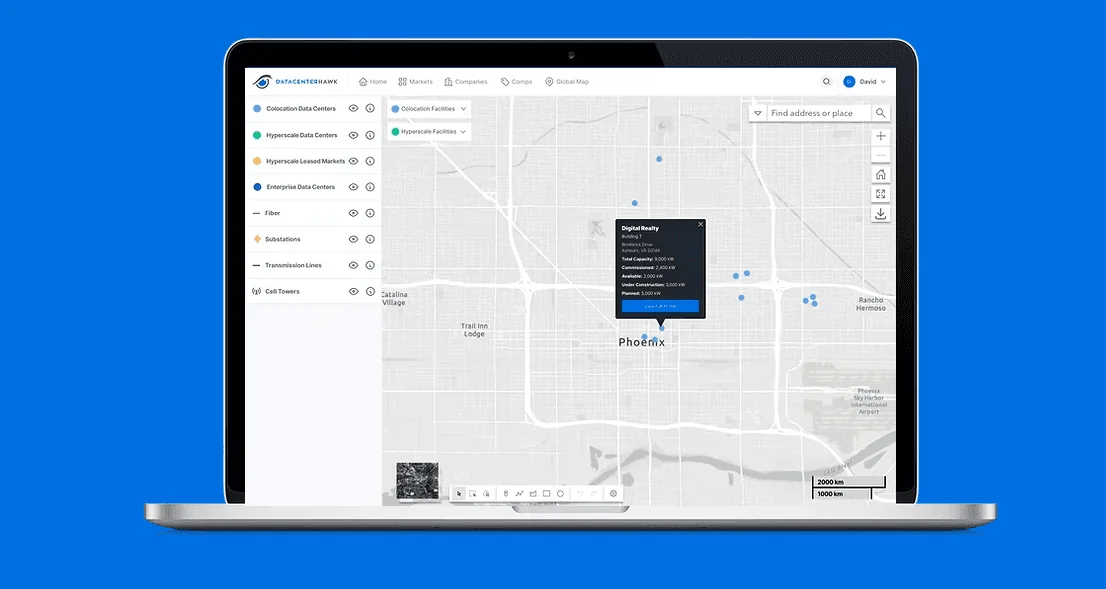
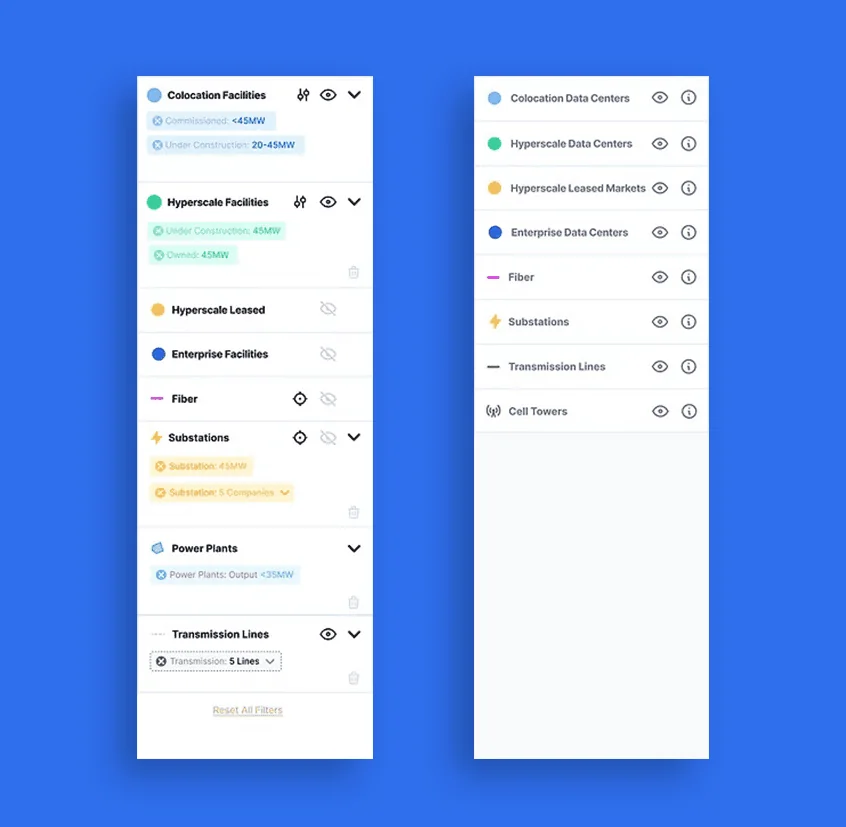
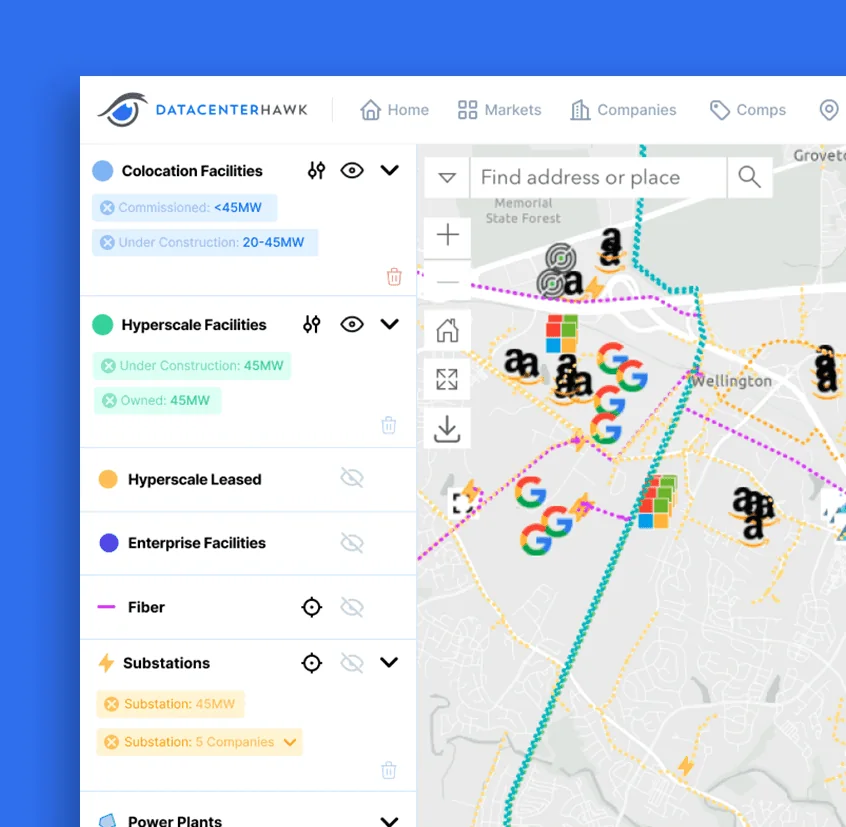
To enhance the updated experience, we implemented a clean, intuitive visual system that emphasized visual hierarchy and clarity. Button UI was refined to clearly indicate the status of applied filters, and the hide/show functionality was made more intuitive, ensuring users could easily manage their filter selections.
Persona
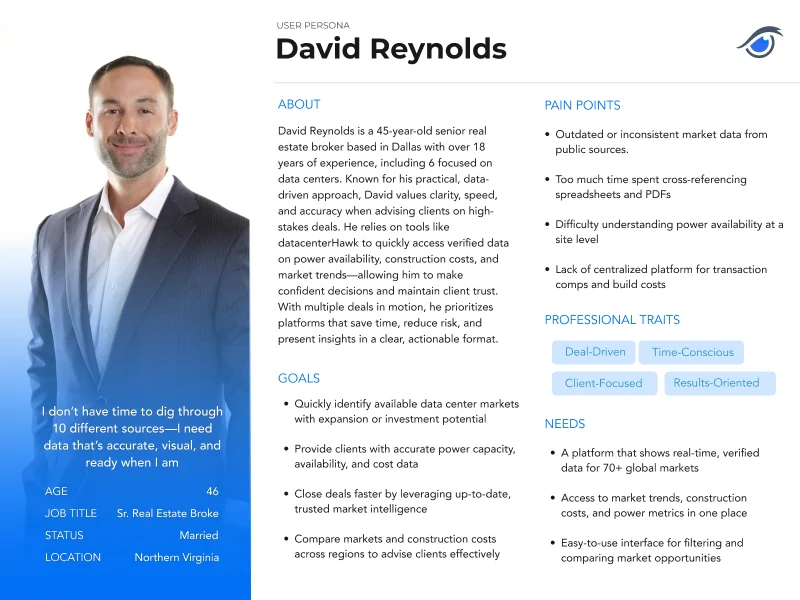
The interviews and analytics converged on one primary user: a senior broker advising clients on high-stakes data centre deals, who spends more of the day reconciling sources than advising. Everything the redesign prioritised — verified numbers, power data at site level, and comparison without tab-switching — traces back to him.
“I don’t have time to dig through 10 different sources — I need data that’s accurate, visual, and ready when I am.”
Goals
- Identify data centre markets with expansion or investment potential
- Give clients accurate power capacity, availability and cost data
- Close deals faster on up-to-date, trusted market intelligence
- Compare markets and construction costs across regions
Pain points
- Outdated or inconsistent market data from public sources
- Time lost cross-referencing spreadsheets and PDFs
- Power availability hard to read at a site level
- No central place for transaction comps and build costs
Key Issues
The previous interface made it challenging for users to clearly identify active filters, adjust settings without losing context, and manage individual filters efficiently. Switching between visualizations like heatmaps, bubbles, or logos was clunky, and users had to manually zoom in to focus on relevant data points.
The redesigned experience resolves these pain points by streamlining the filter UI, introducing intuitive filter management, and enhancing data visualization controls—making the map faster, more intuitive, and easier to explore.
Conclusion
Through subtle UI adjustments, we prioritized accessibility and interaction clarity. Key filtering tools were visually elevated, labels refined, and spacing optimized to guide users naturally through the filtering process. This approach maintained platform consistency while significantly improving user engagement and task success.
Stack
Available for select projects
Have a project in mind?
Fifteen years of shipping digital products for teams like datacenterHawk, Marriott Vacations and Reasons to Believe. Tell me what you’re building.
Prefer email? info@solomonpadilla.com